

Data science has empowered us to solve complex and diverse problems by deploying machine learning algorithms and statistical modelling. Here we have shared the common applications of supervised, unsupervised and reinforcement learning techniques.
Machine learning (ML) is the engine that powers data science. Each ML method or algorithm collects data, transform, and provide an output answer. ML algorithms are programs (math and logic) that adjust themselves to perform better as they are exposed to more data.
The “learning” aspect of machine learning means that those programs changes accordingly to how they process data over time, much as humans change how they process and absorb data by learning over time.
It also powers the part of data science where it’s most critical and trickiest to explain but most exciting to work with. That’s where the mathematical and statistical ‘mojo’ happens.
“Machine Learning is using data to answer questions.”
ML algorithms can be segmented into families according to the type of question they answer. These are the 3 main components of machine learning, which will help guide your thought process when you’re formulating your questions:
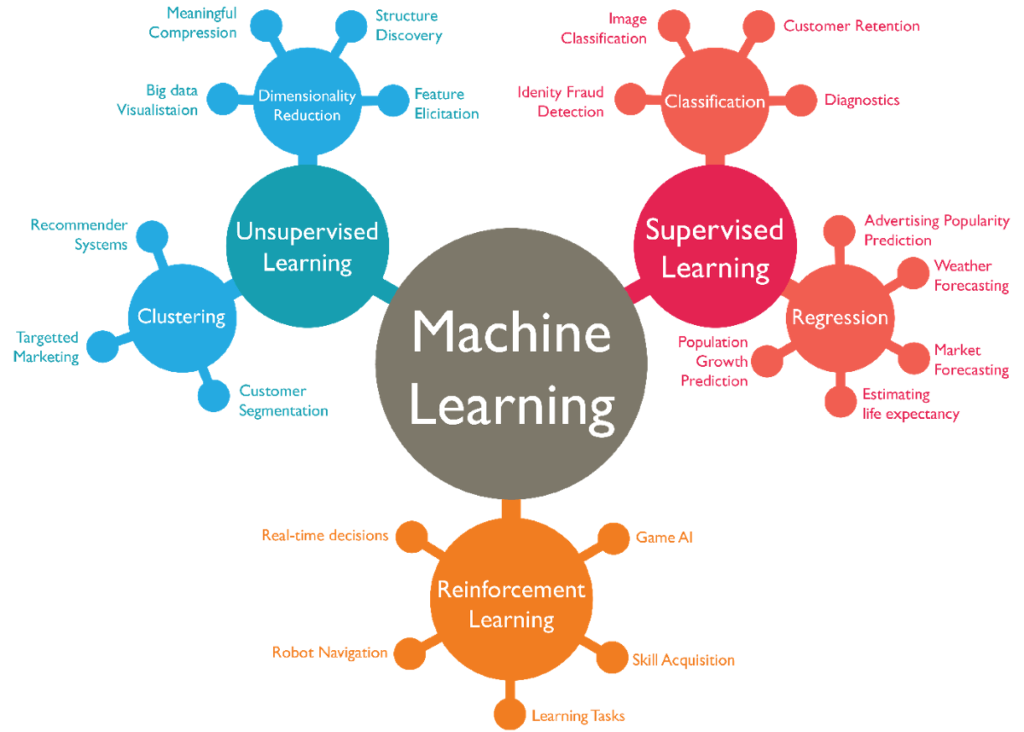
Supervised Learning
Supervised learning is the most common and studied type of learning because it is easier to train a machine to learn with labelled data than with unlabeled data.
It depends on what you liked to predict, supervised learning basically can be used to solve two problems: regression or classification.
Regression:
If you want to predict continuous values, such as trying to predict the cost of a property or the weather in degrees, you would use regression. This type of problem doesn’t have a specific value constraint because the value could be any number with no limits.
Classification:
If you want to predict discrete values, such as classifying something into categories, you would use classification. A problem like, “Will he make this purchase” will have an answer that falls into two specific categories: yes or no.
Well, you can always combine both to get better results.
Is this A or B?
This family is formally known as two-class classification. It’s useful for any question that has just two possible answers: yes or no, on or off, deal or no deal, purchased or not. Plenty of data science questions sound like this or can be rephrased to fit this form.
Some common method used for this classification are logistic regression (it’s the go-to method for classification and most widely used in the industry, commonly used for interpretability) and decision tree (nodes and root node – which represent the best possible answer).
It’s the simplest and most commonly asked data science question. Here are a few typical examples.
- Will this customer renew their subscription?
- Will this employee leave next month?
- Is this an image of a roasted or steamed chicken?
- Will this customer click on the top or bottom button?
- Will these tyres fails in the next 100km?
- Does campaign A or B discount codes result in more return customers?
Is this A or B or C or D?
This algorithm family is called multi-class classification. As its name implies, it answers a question that has several (or even many) possible answers: which type, which person, which part, which company, which candidate.
Most multi-class classification algorithms are just extensions of two-class classification algorithms. Here’s a few typical examples.
- Which ads set in the ad campaign is working?
- Which part of the car is scratched?
- What is the topic of this news article?
- Who is the trainer in this recording?
- What is the tonality of this tweet?
How Much / How Many?
Without a class or category but you’re looking for a number instead, the algorithm family to use is regression.
- What will the wind speed and humidity be next Friday?
- What will my third-quarter sales in Germany be?
- How many kilowatts will be required from the generator to power this device for an hour from now?
- How many new followers will I get next month?
Usually, regression algorithms give a real-valued answer; the answers can have lots of decimal places or even be negative.
For some questions, especially questions beginning “How many…”, negative answers may have to be re-interpreted as zero and fractional values re-interpreted as the nearest whole number.
Some of the commonly used regression methods (aka forecasting algorithms) are linear regression (a relationship between the predictor variables and the explanatory variables) and time-series analysis (a series of data points ordered in time with the required elements of stationary, seasonality, autocorrelated).
Multi-Class Classification as Regression
Sometimes questions that look like multi-value classification questions are actually better suited to regression. For instance, “Which news article is the most interesting to this reader?” appears to ask for a category—a single item from the list of news articles.
However, you can reformulate it to “How interesting is each news content on this list to this reader?” and give each article a numerical score. Then it is a simple thing to identify the highest-scoring article.
Questions of this type often occur as rankings or comparisons.
- “Which pickup truck in my fleet needs servicing the most?” can be rephrased as “How badly does each truck in my fleet need servicing?”
- “Which 10% of my clients will switch from my business for a competitor in the next year?” can be rephrased as “How likely is each of my client to switch from my business for a competitor in the next year?”
Is this Abnormal?
This family of algorithms performs anomaly detection. They detect data points that are abnormal. If you noticed that this looks like a two-class classification question. It can be answered yes or no.
The difference is that two-class or binary classification assumes you have a collection of examples of both yes and no cases. Anomaly detection doesn’t.
This is particularly useful when what you are looking for occurs so rarely that you haven’t had a chance to collect many examples of it, like equipment failures, especially used in manufacturing or production processes to identify defects or irregularities.
It’s also very helpful when there is a lot of variety in what constitutes “not normal,” as there is in credit card fraud detection. Here are some typical anomaly detection questions.
- Production plant applications – Is this gas pressure unusual?
- Social content screening – Is this online content typical?
- E-commerce applications – Is this combination of purchases very different from what this customer has made previously?
As you may have observed, the families of two-class classification, multi-class classification, anomaly detection, and regression are all closely related. They all belong to the same extended family, supervised learning.
They have many attributes in common, and often questions can be modified and adjusted in more than one of them. What they all share is that they are built using a set of labelled-data examples (a process called training) or “trained data”.
Moving on to an entirely different set of data science questions in which originates from the algorithm families of unsupervised and reinforcement learning.
Unsupervised Learning
Clustering – How is this Data Organized?
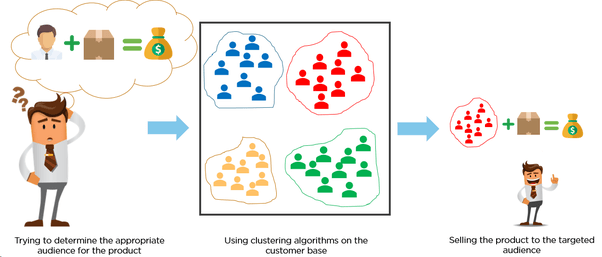
Questions about how data is organized belong to unsupervised learning. There are a wide variety of techniques that try to manipulate the structure of data. One family of these perform clustering, a.k.a. chunking, grouping, bunching, or segmentation.
Clustering is used when training data is unavailable and helps to understand questions like “how is this organize” or “how are data point organized”, in simple terms, is to group items together based on the similarity of features or attributes (distance metric).
The distance metric can be any measurable quantity, as long as you’re able to quantify your collected data, such as the difference in IQ, a number of shared genetic chromosomes in an animal, or how many km/h an eagle flies. Clustering questions all try to break data into more nearly uniform groups.
Which viewers like the same genre or types of movies?
Which printer models fail the same way?
Which day of the week does this building have similar electrical power demands?
What is a great way to break these audiences into four different interest groups?
Dimension Reduction Technique
Another family of unsupervised learning algorithms are called dimension reduction techniques. Dimension reduction is another way to simplify the data, to make it both simpler to communicate, quicker to compute with, and easier to store.
At its core, dimension reduction is all about creating a shorthand for describing data points. It is a process of reducing the number of random variables under consideration by obtaining a set of principal variables – which can be approached by feature selection and feature extraction.
A great example is a college student’s academic performance, illstrutrated in the form of CGPA. It is measured in dozens of classes by hundreds of exams and assignments, gauging how well the student understands their field of study, but a full listing of them will be overwhelming to any recruiter.
Thankfully, you can create a condensed summary just by averaging all the scores together. You can get away with this significant simplification with the presumption of students who do well on one assignment or class will do well in others.
However, by using the CGPA rather than the breakdown of each subject within the field of study, you do lose richness. You wouldn’t know if the student is stronger in his/her analytical skills, critical skills, or creative skills related to subjects. But what you gain is simplicity, an overview of his/her competencies and it’s a lot easier to discuss and compare student’s strengths and weaknesses.
If your goal is to summarize, simplify, condense, or distill a collection of data, dimensionality reduction and clustering are your tools of choice.
Reinforcement Learning
What Should I Do Now?
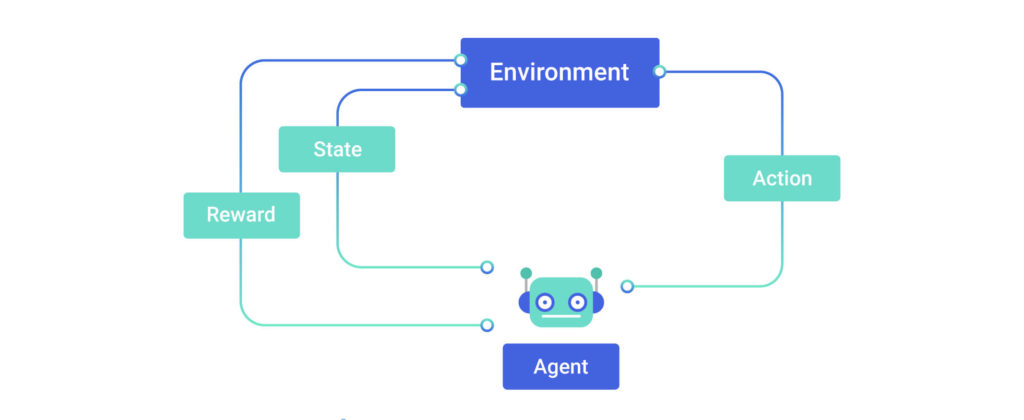
A third extended family of ML algorithms focuses on taking actions. These are called reinforcement learning (RL) algorithms.
They are a little different than the supervised and unsupervised learning algorithms. A regression algorithm might predict that the energy produced from the wind speed (kW/h) tomorrow, but it doesn’t decide what to do about it.
An RL algorithm proceeds to the next course of action, such as turning on the air conditioner or heater in an official building during different climate season
RL algorithms were originally inspired by how the brains of rats and humans respond to punishment and rewards.
Naturally, the chosen actions will draw towards actions that will earn the greatest rewards and staying as far as possible from punishments or pain. You’ll have to lay out a set of possible actions as parameters, and they need to receive feedback after each action on whether it’s a positive, neutral, or a mistake.
When we talk about automated systems, RL algorithms will be a good fit especially micro-decision without human’s involvement is needed. For example, robotics navigation, heating, cooling, lighting systems etc.
Artificial Intelligence is heavily relying on RL algorithms to uncover more conditions. Based on these multiple conditions established through RL algorithms, then a decision will be formulated for the next course of action in which can be illustrated as a probability.
Questions that RL answers are always about “what’s the next action”, although the action is usually taken by the machine.
- Where should I place this ad on the website such that visitors would click most?
- How much budget should I put into this ad campaign?
- Should I adjust the temperature higher, lower, or leave it where it is?
- Should I vacuum the living room again or stay plugged into my charging station?
RL typically requires most effort for it to function than other algorithm types due to its deep integration with the rest of the system. They’ll become ‘smarter’ as they learn and gain more data, through trial and error, certainly it’s a continuous process!
If you enjoyed reading this, do share with us your thoughts in the comment section below.
If you are interested to learn more about programming, or if you aspire to become a data scientist, LEAD offers a complete data science course in Malaysia that is designed to equip you for a career in data science within 8 weeks.
What are you favourite programming languages for data science? Leave them in the comment section below.
Don’t forget to visit us on Facebook and subscribe to our YouTube channel for more interesting content too.
0 Comments