

How to Design Effective Presentation Slides & Data Visualization That Grabs Attention
You have the technical skills to create a presentation.
It’s a given since presentations are common, if not daily, occurrences in our work life.
But do you know how to fully utilise your slide tools to present your data?
We had a chat with Irvin Hoh, the entrepreneur of Power Visual Storytelling, to learn more on how we can create effective presentations with data visualisation and visual storytelling.
1 – Start with Your Audience
As Irvin says:
When we design, we usually don’t design from our own perspective, but from our audience’s perspective. That’s why it’s very crucial to know what is your audience’s need while designing your presentation.
Hence, the very first step to designing an effective presentation is to know your audience.
You can have the same content for different groups of people, but the slides you design for each audience will differ based on your target audience’s experience, knowledge and expectations.
For example: if you are presenting programming concepts to a group of beginners, your audience will be new to your topic. So, they will need more guidance and detailed explanations within your presentation.
On the other end, an audience made up of tech company CEOs is looking for information that provides insights into a bigger picture. They don’t necessarily want to go into the technical details.
Once you understand your audience’s capabilities and desired outcomes, customize your slides according to their needs.
So if we are creating a presentation for CEOs, Irvin recommends starting the presentation with a one-slide executive summary.
By informing your audience of the overview beforehand, it will address what value they will gain from your presentation and allows them to focus on your message.
You will also need to think of how your audience will process and understand the content of your slides.
Is it easy to understand the information? Does the slide bring new insights to the presentation or does it seem redundant?
Afterwards, play around with the design tools to deliver your information in a concise and clear manner.
Here is a common presentation tool:
Some presenters may argue that presentations should not have bullet points because it may involve unnecessary reading. Other presenters defend that it is a tool that helps audiences follow the presentation.
If bullet points are used wrongly, you will fall for the common mistake of ‘death by PowerPoint’.
This happens when presenters copy and paste sentences from their notes onto the slides and read off the slides.
This method is useful for the presenter, but it will bore the audience. It gives the impression that the presenter is not competent enough to deliver useful information.
To communicate effectively with presentation tools, you have to know the purpose behind the tools.
The key purpose of bullet points is to highlight key information to your audience.
Hence, Irvin advises that bullet points can be used so long as they reveal a larger context in which you can build upon.
In this way, the bullet points will provide trigger words that help you develop your presentation.
2 – Adapt to the Audience’s Viewing Experience
Environmental surroundings can also affect how the audience will perceive your slides.
This year, most workshops and group meetings have been transferred online due to the COVID-19 Pandemic.
During this time, Irvin notices that there are significant differences between online and F2F presentations based on his audience viewing experience.
When it comes to online presentations, smaller fonts and muted colours are preferred because your audience is closer to their screen.
In face-to-face presentations, you will need to use large fonts and bright colors to attract the audience’s attention, especially for those at the back of a large seminar room.
Be aware of where your slides will be shown. Then, tailor your slides based on how your audience will view them in that scenario.
Learn to build presentable & insightful dashboards, and learn data storytelling now.
3 – Design Presentations with the POWER Formula for Data Storytelling
Rather than teaching soft skills, like body language, or 101 tech skills for PowerPoint, Irvin uses a structural guideline to help his students design purposeful and effective presentation slides.
This guideline is called the POWER formula.
P – Prepare for Your Audience
Give yourself ten to fifteen minutes to place yourself in your audience’s shoes.
Once you know what your audience is looking for, it will give you a clear direction on how to draft out your presentation.
O – Objective is Key
Align your objective with your audience’s objective by tweaking your message in a way that responds to their concerns.
This can be done by compiling information in your research that supports your message into a draft document. It will provide the backbone of your streamlined content, delivering concise information without unnecessary details.
W – Weave in the Stories
Humans like to hear stories, not textbooks.
Don’t design slides for the sole purpose of giving information. Design it in a way that tells a story of how your audience can start their journey and end with their desired goal.
E – Express visually
Every slide should have something to see, whether it would be charts, diagrams, or even a picture of a person.
This is because text-heavy slides will distract the audience from the speaker and valuable spoken information. It also may bore your audience.
Even if you choose to have a text-only slide, play with the fonts to make the text visually more stunning, such as using bolding or making the title italic.
R – Relate to Design Best Practice
Finally, appeal to your audience’s visual perceptions. Here, you are finding out how the flow of the presentation slides affects the way your audience will process the information.
This can be done by asking a third person to look through your slides. As they are looking through the presentation, observe where they’re focusing their attention.
Then, ask them for feedback on the flow of information. What they like or don’t like about the slides? This will help you identify the pitfalls in your visual presentation.
By following the POWER structure, it becomes easier to design presentation slides that will grab your audience’s attention.
4 – The 3 Principles of Data Storytelling & Presentation
In data presentation, Irvin states that there are three principles we need to follow.
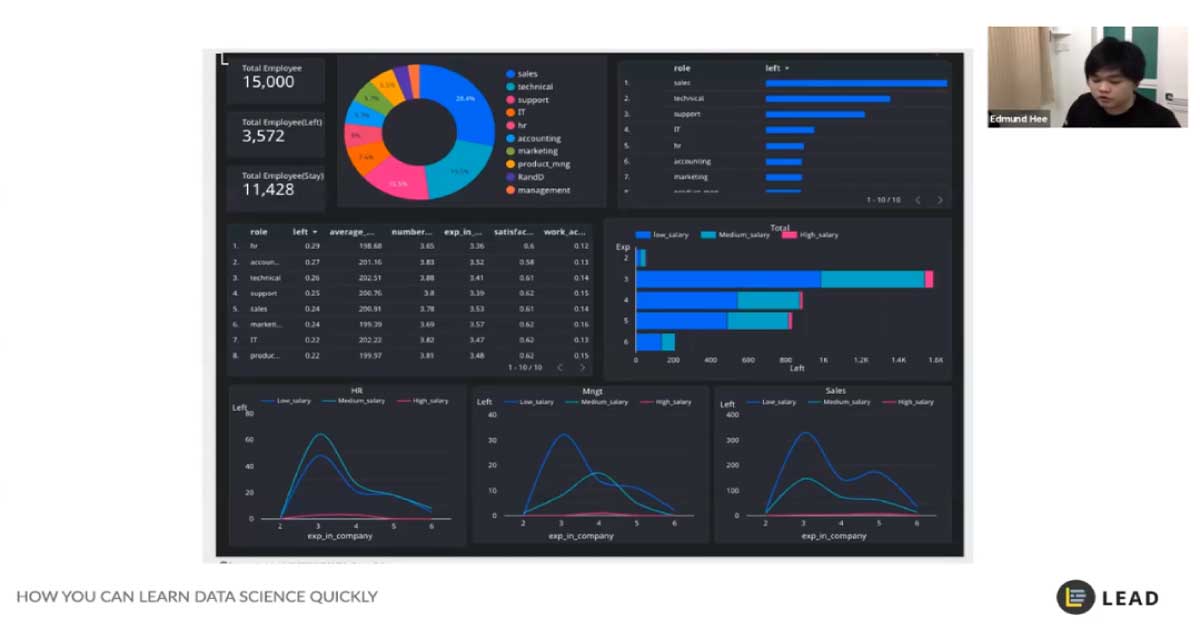
i. Human-Friendly Charts in Data Storytelling
A common mistake most engineers and technicians make is ‘death by Excel’. This happens when raw data from a spreadsheet or data platform is copied and pasted onto a slide.
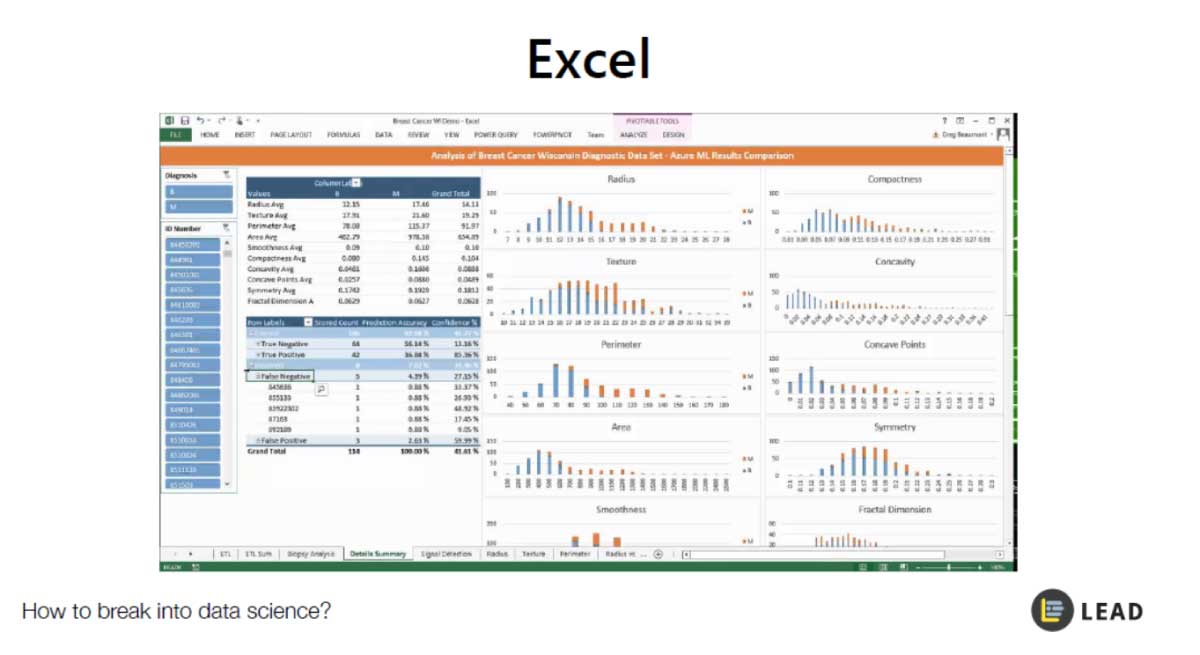
For most audiences, raw data can be overwhelming. Many people will find difficulty in making a connection between the numbers and the meaning behind them.
So when designing charts for data visualization, you need to create charts that are easy for humans to understand.
You can do this by getting rid of repetitive information and organizing your data based on insights that can be drawn from them. Your charts or tables should be a simplified version of your existing data.
In this way, your audience will resonate with what is on the chart and have a better understanding of the implications behind the presented information.
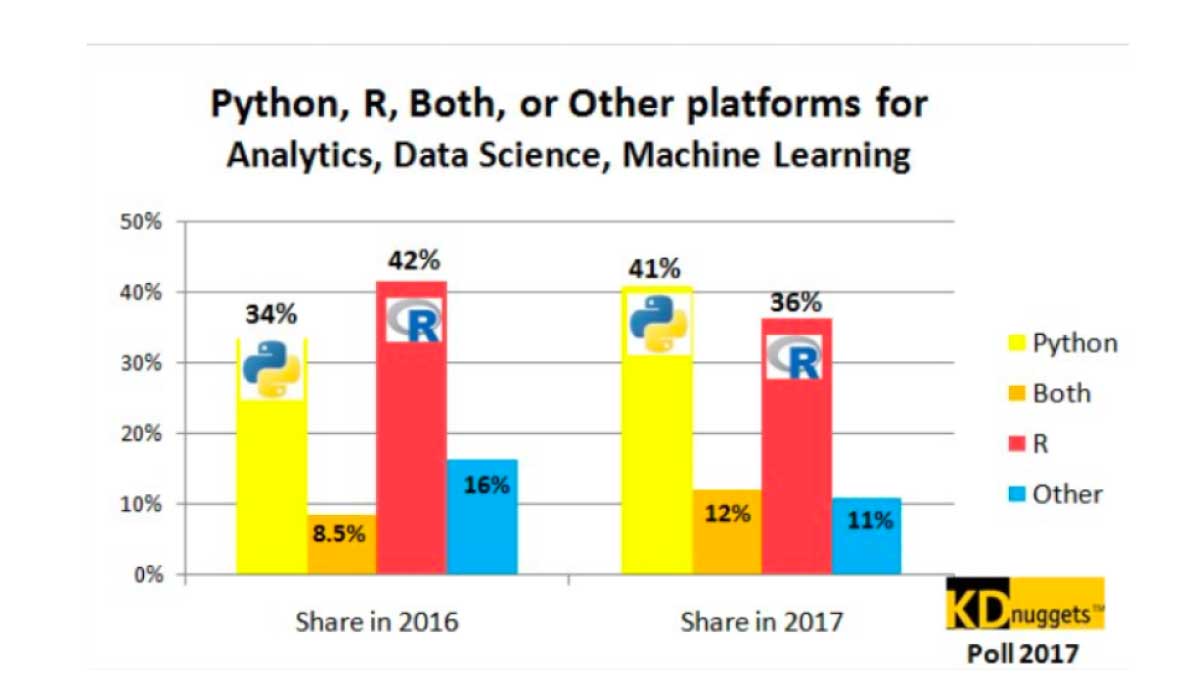
ii. Simple and Readable in Data Storytelling
Many chart templates on PowerPoint come in with dynamic designs and animations to attract the audience attention.
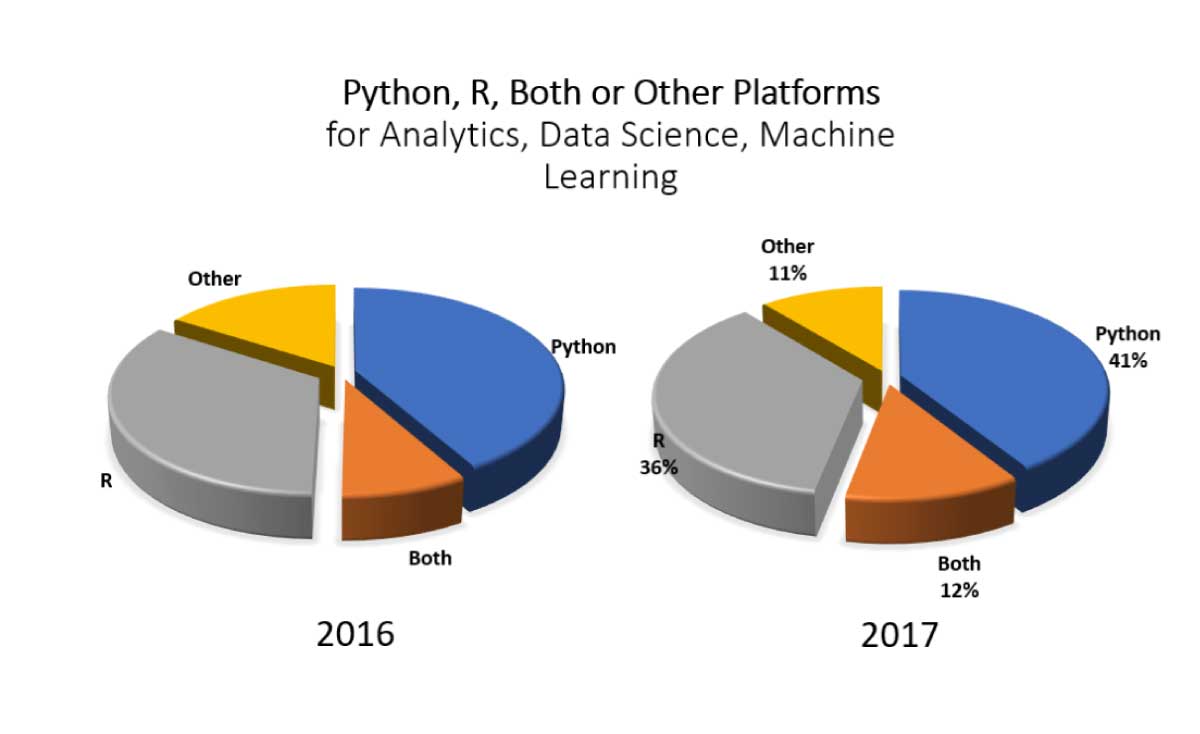
These charts are amazing to look at – but they are chart junk.
Chart junk is unnecessary design details that distract audiences from the data presented. They may end up obstructing your viewers from understanding the information.
Rather than stick to the chart’s default settings, use them as a template to create a simple, yet attractive data chart that is easy to read.
iii. Clear and Insightful in Data Storytelling
In all honesty, your audience doesn’t care about how you crunch the numbers – they care about the final result and the insights it brings.
So be direct: point out the key observation of your chart to your audience.
This can be done by putting the main takeaway of your chart as the chart’s title, rather than a typical y over x-axis title.
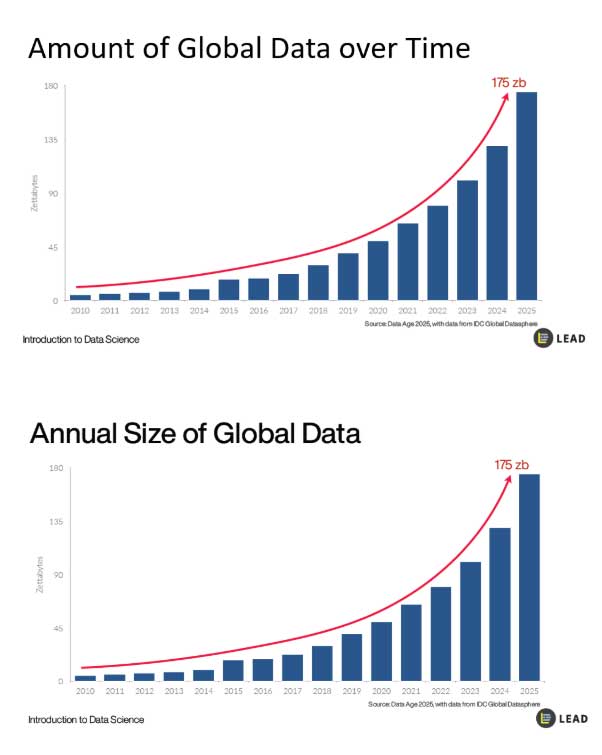
You can also annotate where significant changes are made and why it is significant.
How You Can Design Slides for Data Storytelling
Now you know the theories on how to design effective presentation slides.
But to create effective presentation slides, you will need to practice. This requires time, patience and some guidance.
This will be difficult for people who do not have an artistic or design background. Not everyone has immediate access to a third party who can give them valuable feedback.
In response to this need, Irvin launched Slaideck.

Slaideck is an AI application that guides users in creating impressive slides based on their presentation notes.
On Slaideck, users will upload an outline of their presentation. The AI will then analyse it for keywords and suggest design templates that users can customize further to their liking.
Irvin hopes that more businesses will use Slaideck as a means to save presenters time while subtly teaching them the principles of visual storytelling and data visualization.
Final Thoughts
When it comes to designing effective slides, Irvin’s main takeaways are:
- Always keep your audience in mind when designing slides.
- Know the function of your slide tools and use them with purpose.
- Make your presentation simple, clear and insightful.

0 Comments