
At this time of writing, more than 5500 people have contracted the Wuhan coronavirus (2019-nCov), with cases reported in many countries – causing huge concern to the public.
This brought birth to a boom of unverified or fake news being shared on social media that only make the situation worse by causing panic to the public.
Rather than sitting idle, LEAD CEO, Dr. Lau Cher Han decided to take the proactive route to form a group of volunteers, comprising of IT professionals, data scientists, healthcare professionals, and concerned public to build a web application tool that helps the public track the development of the deadly coronavirus 2019-nCov in real-time.

This is a story of the development of CoronaTracker.com.
A call to arms
The domain CoronaTracker.com was registered a day before the Chinese New Year celebrations.
Dr. Lau then set up a public group on Telegram, inviting volunteers on Facebook to join and help build the tool – following a Hackathon methodology.
The first day alone, more than 100s of volunteers from Malaysia, Australia, Japan, Philippines, Singapore, Taiwan, USA, and other countries joined the call to arms to work on CoronaTracker.com.
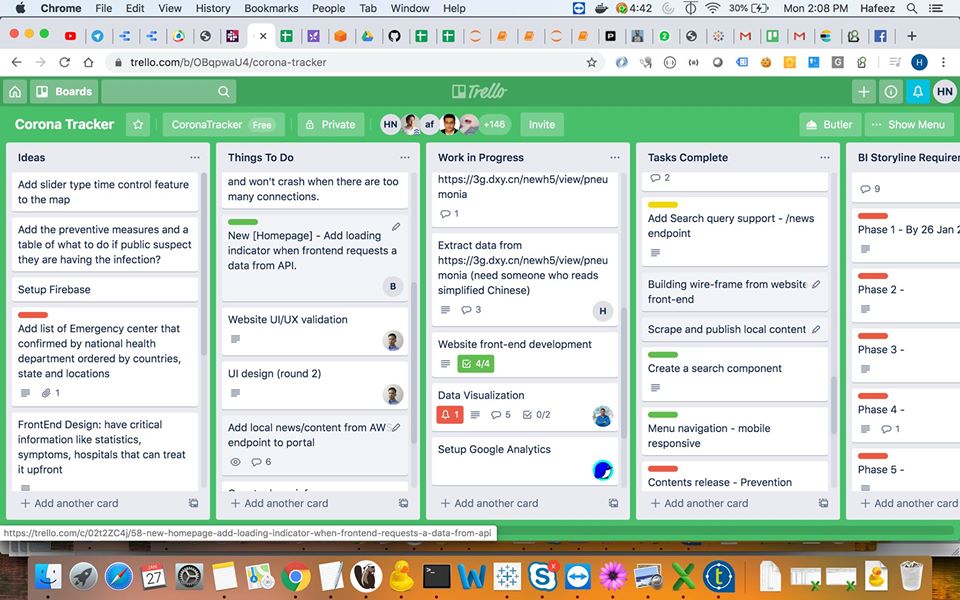
Using the OSEMN framework in data science, the project kicked off with the collection, cleaning, exploration of data, followed by modeling and having the data presented as a visualization on the site.
The web scrapers were built using Python and BeautifulSoup, to scrap news from recognized and authoritative sites, including sites that presented data on the coronavirus spread.
The goal for the MVP of CoronaTracker.com was to be a news aggregator that summarizes news from recognized and authoritative outlets, using data science methods, such as NLP (Natural Language processing) to analyze content and identify meaningful topics.
Using AWS as the platform to host the scrapers, web API and website, the front-end of CoronaTracker.com was built with Vue.js and the backend with Node.Js and ExpressJS – with the help of some volunteers who were Full Stack developers and UI/UX designers.
A data lake was deployed to dump raw data and using MySQL, the raw data was converted to structured data for presentation.
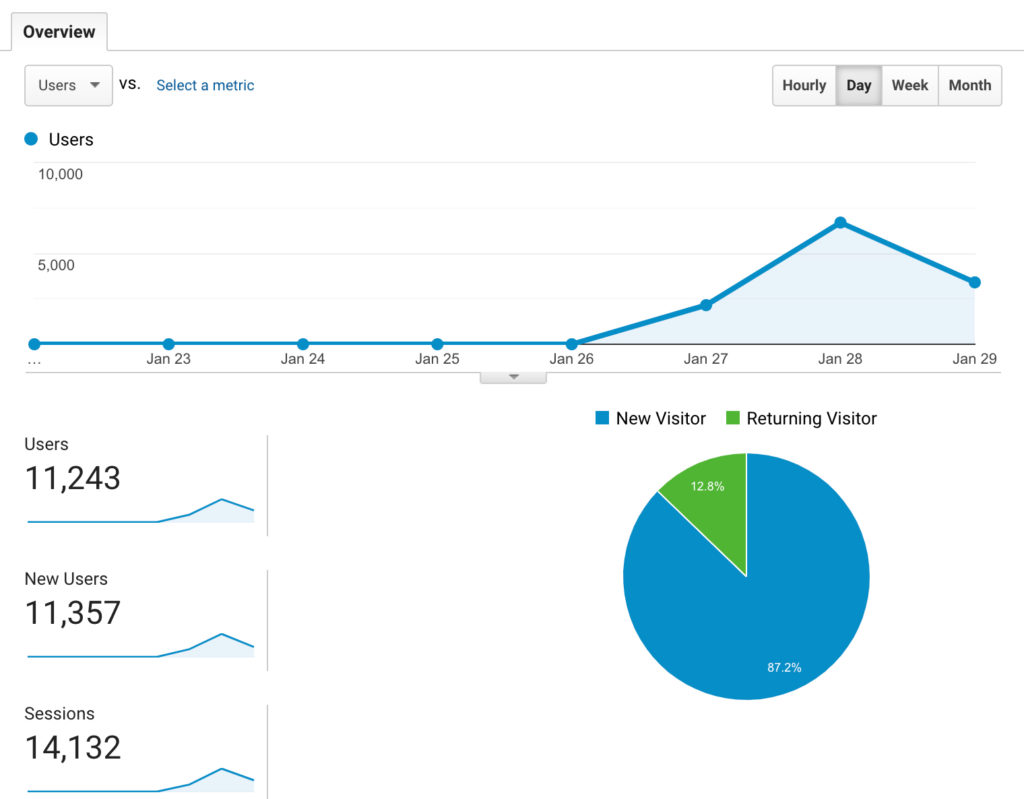
By the end of 2 days, the website went live and more than 11,000 people have been using the platform to keep track of the development of the coronavirus around the world and in their regions.
Tracking the outbreak with CoronaTracker.com
The homepage of CoronaTracker.com is where you can find trusted news articles. Each article listed here are also filtered by a group of volunteers who are among them, data scientists and medical professionals.
You can also filter the news, analytics and screening centers by country and state, to further learn about the development within your region.
A key feature of CoronaTracker.com is the real-time analytics dashboard where it features important data and their visual representation including the total confirmed cases, the total number of death, outbreak time, and countries affected by the epidemic.
Data for the dashboard were mainly sourced from CDC, JHU, Tencent and more.
While there exist other tracking websites as well, CoronaTracker takes a few steps further to track the break of the coronavirus over time.
What’s next in the plan?
At this point of writing, more refining is being done to CoronaTracker.com, to scrap more data from sites with different locales, such as Chinese sites and to add more features to the website, such as a location map of current cases.
A mobile app for the public to receive real-time push notifications on the update is also underway.
Want to support?
Whether you are a LEAD student, expert or someone who’s passionate in making a difference – you’re welcome to join us and contribute.
Join the telegram group at: CoronaTracker Telegram Group
You can access the scraped data to do your own analysis or prediction here: CoronaTracker Analytics on Github
The development and launch of CoronaTracker.com will not be possible without the help and hard work of all 400 volunteers to stepped up to join the cause. We thank you for your support and for making a difference.
Check back this post for on-going updates, where we will credit the volunteers who contributed to making this a reality.
Wow, you did a good job.
By the way, the database research group at Tsinghua University has developed a real-time visualization dashboard for 2019-nCoV. This dashboard provides heatmaps for total confirmed/recovered/died cases (from world level to China-cities level), the trend of daily increased cases, types of patients, distributions of patients’ age, cure rate-died rate, and etc.
Thank you for sharing and supportive feedback.