

Data storytelling is becoming popular in the past few years. Not because storytelling is becoming more important (it always has been), it is because we are dealing with more and more data.
What is data storytelling?
Data Storytelling is the new way to get your team the answers they need about your business.
It’s proactively giving every single one of your users a personalized data brief instead of forcing them to go find answers in dashboards they aren’t using.
It’s one presentation, to align your team’s direction and strategic decisions. In short, getting everyone on the same page.
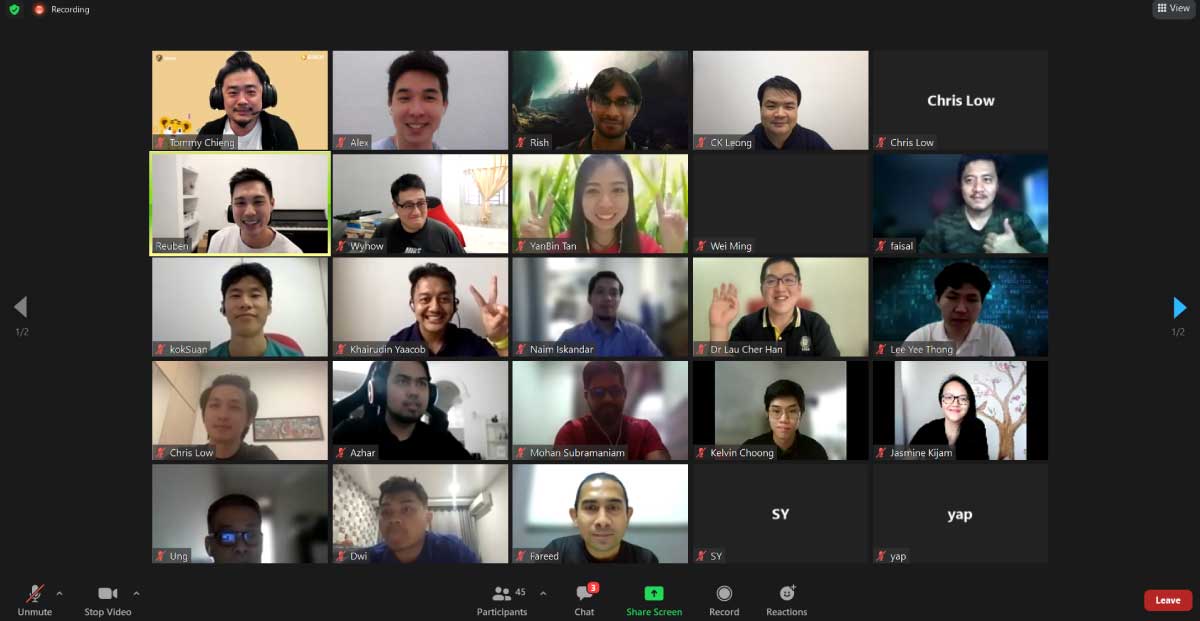
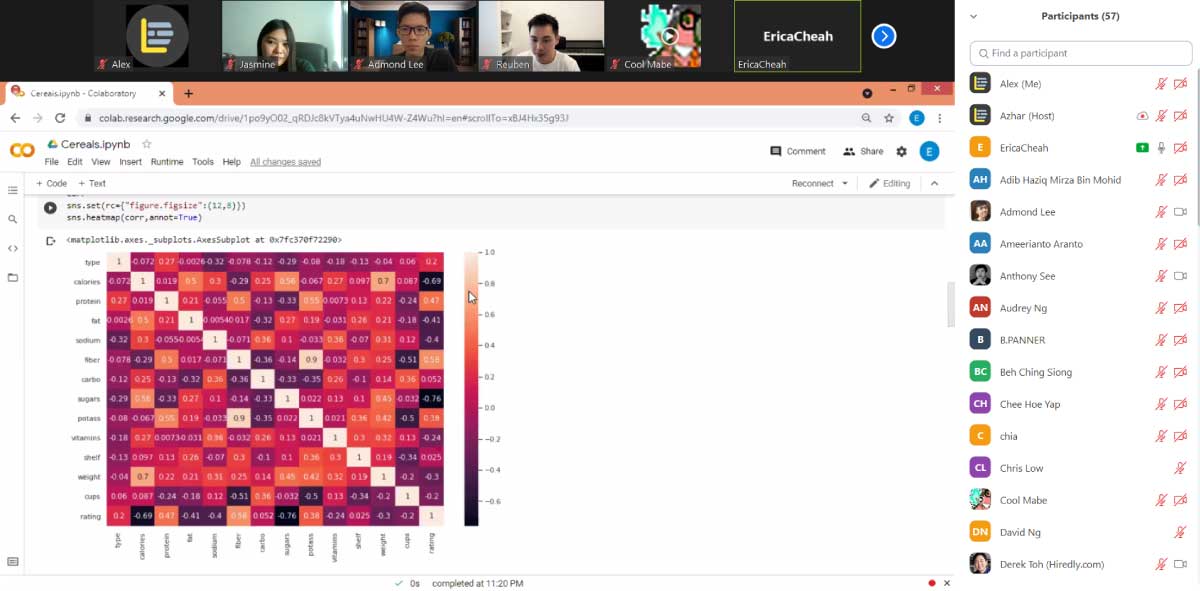
I attended a demo day late last month where 21 of our data science bootcamp graduates presented to a panelist consisting CEO, data scientist, data engineers, and ML engineers.
Here are three tips that I think will be useful for your next data presentation, even if you are a beginner.
Story, story, story!
People love stories. It doesn’t matter whether you are a web developer, machine learning engineer, or a CEO. Stories help us to make sense with hard cold numbers and facts. For example, which of the following is easier to remember and leave an impression in your head:
- 2% of our adult population is infected by Covid-19 virus
- 1 out of 50 of your adult friends was a Covid19 patient
The answer is pretty obvious right?
The first step to telling a good data story is to uncover a story worth telling. Data is just there to support.
You can start by asking a question or forming a hypothesis, then digging into relevant data to find answers. Then, use these answers to structure the flow of your story.
Here are some items that we always find from our data and use as signposts:
- Patterns – Something that happens over and over again, or characteristics displayed by particular data points.
- Trends – It indicates what is happening and changing over a period of time. It is crucial for us to respond and prepare for upcoming events.
- Outliers – Data points that don’t fit well with others. These are usually signals that prompt us to ask more questions which often lead to a more interesting exstory.
- Counterintuitive data – These are data points that give a surprise to your audience. Understanding what causes these results sometimes make our stories more compelling.
One panelist also highlighted the importance of having a CTA (call-to-action) at the end of a data presentation. In a sales presentation, CTA is to remind customers to take action.
Having no CTA left your audience hanging without knowing what to do.
In a data presentation, a CTA persuades the audience to take action to support your case. In other words, to recap why your presentation matters.
If you don’t include a call to action in each presentation, your results will fall short of their potential impacts.

Love your audience and they will love you back
The success or failure of your data story depends on your audience. Therefore, always try your best to make a strong connection with the audience.
There is no such thing as “this presentation is for everyone”. Even a presentation on a generic topic like “save our environment” requires a different story when we present to a 5 year old kid, vs a 40 year old working adult.
We need to understand the audiences’ background, their technical understanding, and the lingo that they use.
While it is not possible to tell a story that everybody can accept. But as presenters we should customize the story from different angles, so that most of our audience can understand where we are coming from.
Our job is to guide and lead our audience by uncovering the facts and reveal insights that they should know. At the beginning, our audience was clueless.
Another thing is that the audience will focus their attention on us, the presenter, during a data storytelling session.
If they can feel that we make the effort to have them in our mind, it is a great opportunity to show your interests, passion, and build our personal branding at the same time.
DTSTTCPW
No, this is not a typo. It’s a short form for Do the Simplest Thing That Could Possibly Work. Always begin with the simplest thing during your data presentation.
Let me explain what it means.
Many people try to use something that is overcomplicated to impress the audience while delivering their presentation.
They show how they build a model using deep learning, instead of some simple regression model.
Most of the time the presentation are timed. So they run out of time, by the time they finished explaining all the concepts. And didn’t get to explain the important bits of their work.
During a formal business presentation, most managers and the management couldn’t care less about coding and complex models.
They are interested in finding ways that either help them to increase the revenue, or to reduce the cost.
Don’t forget that you have a Q&A session after your presentation. Make full use of that too. Don’t have to reveal all the secrets to your audience during the presentation.
Intentionally leave out some important details, so that they get to ask questions and have more interactions with you afterwards.
Conclusion
Data storytelling is all about helping our audience to understand context and to inspire actions that lead to positive changes.
Data scientists and data analysts should always use this tool to present data, communicate complex ideas, so that we can simplify the decision-making process for our stakeholders.
What are your experiences in using stories to convince people? Be it asking for a pay raise, or persuade your wife to let you buy a PS5? Let me know in the comment section below!
Your work matter, and you need to be heard. That’s by doing impactful data presentation that inspires action. Become a data professional in 30 days now.
0 Comments