

“Dr Lau, What is SQL?”
“Dr Lau, What is Python?”
“Dr Lau, What is R?”
“Dr Lau, What is Power BI?”
That’s questions we often receive. And it’s perfectly normal if you’re just getting started in learning data science.
Today, let me explain all these terminologies in a fun and layman way – so you can understand how we use these tools in data science.
SQL, Python, R and Power BI are the tools that data scientists use in our daily tasks. We use them to retrieve data, process data and also present data.
SQL is the short form for structured query language and It’s pronounced as SE-QUEL.
We use SQL to retrieve our data stored inside a server.
So let’s say you’re running a restaurant and you have a database call restaurant.
The database has many tables that store data about our customers, suppliers and menu.
And then inside the menu table, we store the dishes names, the type of dishes, and the price.
For example,
- Fish and Chips — Meal — RM25
- Chicken Chop — Meal — RM18
- Coffee — Drinks — RM8
- Tea — Drinks — RM4
- Cheesecake — Dessert — RM5
- Cookie — Dessert — RM2
*Tummy growling*

Okay now, if we want to retrieve all the desserts from our database, we can then write a sequel query that says:‘This query will help us to retrieve all the dessert items on our menu, or if we want to retrieve all the dishes that are below RM10’
We can write a query that says, ‘These will return all the items that are below RM10.’
Pretty cool, right?
So, now you know – this is SQL. We use it to retrieve data from our database.
Now, after we have to retrieve our data, what we need to do next is to process our data.
And this is where we need to use a programming language to help us.
Hang on a minute. Now you might want to ask. “Hey, Dr Lau, why can’t we just use Excel?”
Do we need a programming language for data science?
The answer is yes, you have to because there are some limitations with Excel.
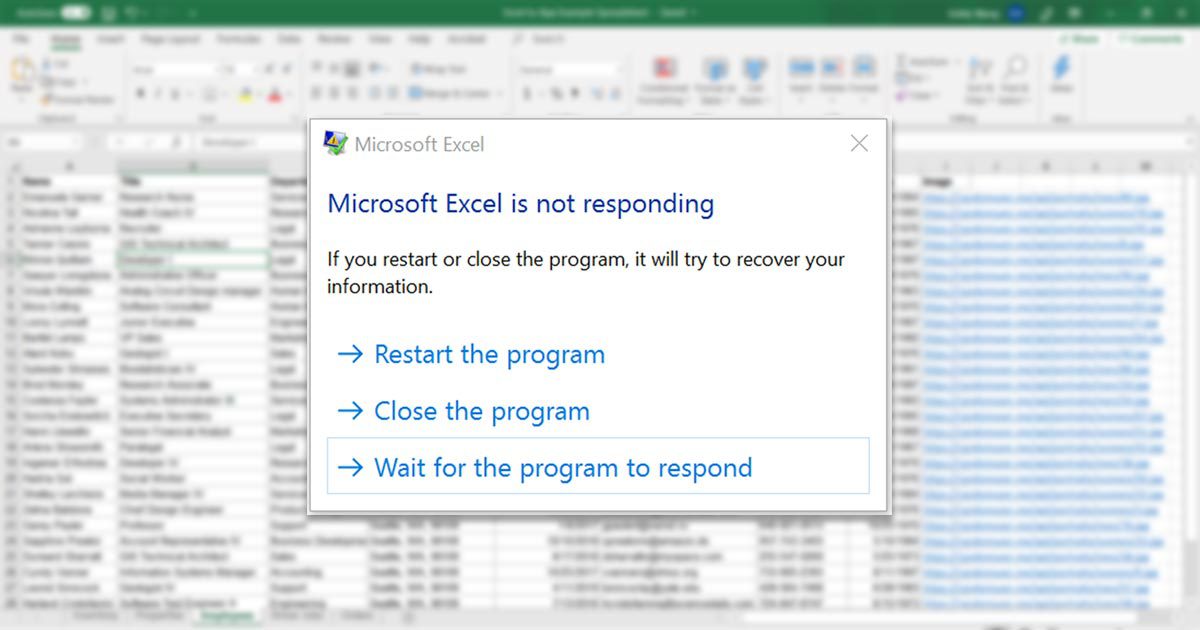
Well, first of all, Excel can only handle up to 1,048,576 rows.
Yup, it might sound a lot. It’s sufficient for general use cases, but when you have data coming in every minute or multiple tables with hundreds of thousands of rows, Excel becomes very slow.
And it might hang a little…
No #2, Excel is unable to handle repetitive and boring tasks.
Excel is good when you have a formula and when you want to apply your formula across a dataset.
But when you have a repetitive task such as crawling the prize and images of 100,000 items from Shopee, or you want to scan your tweeters to find out where your followers are from —
this is something that Excel cannot do.
No #3, Excel can only perform basic analytics but not machine learning.
Excel is good if you want to run descriptive analytics to find out the average, the max, the mean, or to use charts for basic regression, or if you are going to use a pivot table to slice and aggregate your data.
But if you want to be a classification model, group similar items together, using clustering or recommend items based on your user preferences — this is something that Excel can’t do.
So, to overcome these problems, we will need to use a programming language and the 2 most popular programming languages for data science are Python and R.
Programming
Technically you will need the most basic programming skills. Because it’ll help you to speed up different processes in data science.
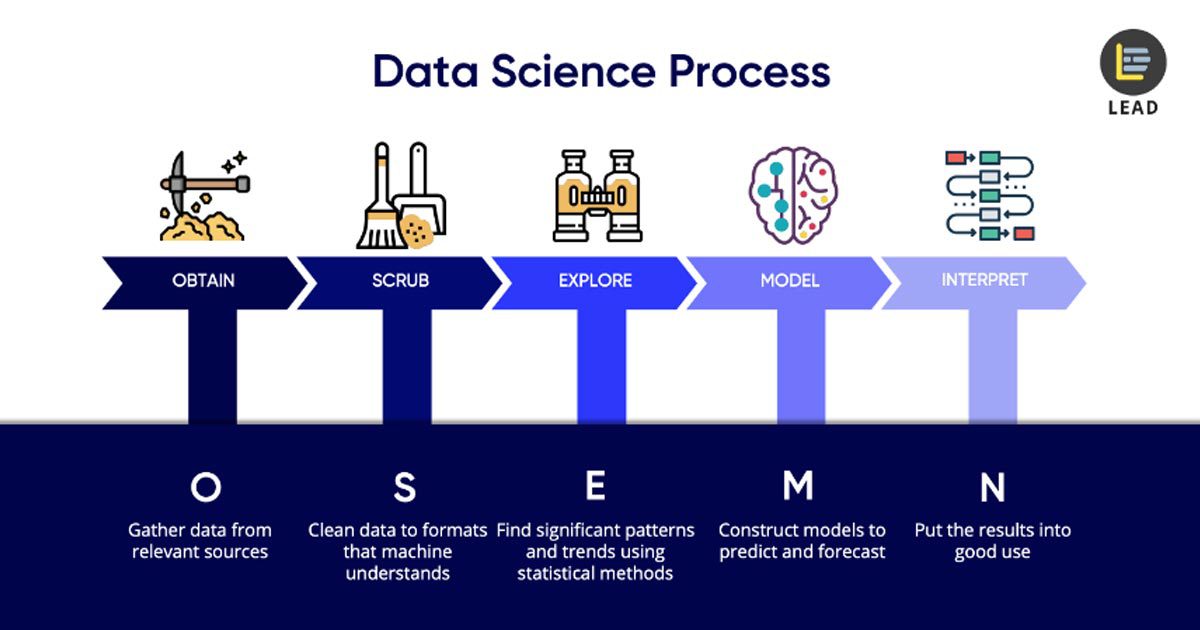
For example, once you get your dataset, you need a programming tool to process your data. During this process, we obtain, scrub, explore, model, interpret the datasets. So, you’ll have a cleaned dataset that speaks to you about your business problems.
We call this OSEMN Framework. Check out my previous video, where I explain this process clearly. The OSEMN Framework in Data Science.
To be frank, the internet is blowing up with all kinds of suggestions and explanations that could confuse you from following the right direction that you probably need.
Let’s imagine this, What is the difference between all music players out there?
They all play music anyway. However, a few features that differentiate them makes you decide to pick one for your best use.
On the other hand, the programming tools are the same as that. Let me share with you the difference between Python and R.
Generally speaking, Python is usually used by anybody from any field, including data scientists, people from computer science, or engineering background, R is often used by specialists who have a background in mathematics and statistics.
So if you are a complete beginner who has no background in technology, start with Python first.
Because Python is more of a general programming language, and we use Python not only in data science. We also use it in Web development, IoT, finance, and many other industries.
At the end of the day, it doesn’t matter which programming language that you are using. What is more important is your results, and how you deliver your results.
Hey, speaking of which, this is when you need Power BI.
Power BI
As the name tells us, Power BI is a BI tool, which stands for business intelligence. This means we use business analytics tools like charts, interactive data visualizations, and also data mining techniques to help organisations to make data-driven decisions.
And Power BI is one of the popular BI tools developed by Microsoft. You can use Power BI the idea generated dashboards and reports that you can use to extract insights from and also use these insights to answer your burning business questions.
Of course, Power BI is not the only BI tool in the market. Other platforms like Tableau, Google Data Studio, Metabase, etc. They are equally powerful alternatives as well.
So, choosing which BI platform depends on your use case application and of course, your company’s budget.
Conclusion
By now, I’m sure that you have a much better idea of what those terminologies are and how they can play a role in your job and in pursuing a data career.
If you could choose to learn any of these tools right now, which one would be your first choice and what would you like to do with it?
Let me know in the comments section. I’ll see you in the next video, and do join us on LEAD Knowledge Circle.
0 Comments